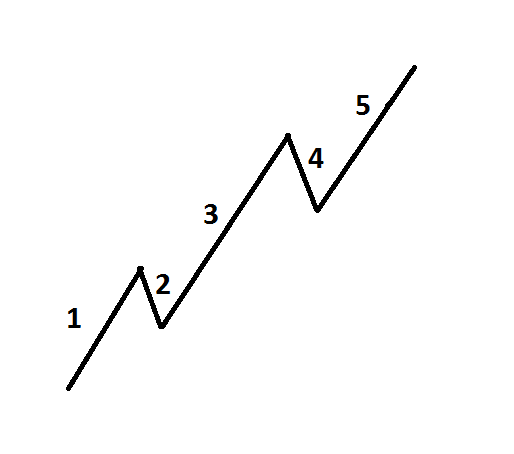
The Elliot Waves Cycle
The main idea of Elliott Waves theory is the following: on either bullish or a bearish trend, price forms sequences of 5 waves; three of those waves are directed by the main trend and two of those waves are directed against the main trend. The first, third and fifth waves are called impulse waves, the second and fourth waves are called corrective waves. After five waves sequence was formed, three waves sequence on the opposite direction must be formed, making in total eight waves “cycle”. This cycle is called Elliot Waves Cycle. On larger timeframes cycles are becoming waves, meaning eight Elliot Waves Cycles are forming one new Elliot Wave Cycle on larger timeframe. It works the opposite way as well; big patterns can be divided into smaller degrees. That is why all waves perform as both pieces of a bigger pattern and at the same time are containing smaller waves themselves. This peculiarity of the Elliot Waves is known as fractalisation. Now let’s discuss what fractals are.
Description of the 5 Elliott Waves
Fractals are known as formations that can be divided into parts; each of those parts looks as the exact copy of the whole. The exact description of the Elliot waves can be seen below:

Wave 1 – Occurs when the "market psychology" is almost completely bearish. The news is negative. Usually it is very strong, market sentiment is changing sharply (changing the bearish trend to bullish, breaking through a powerful resistance level, etc.).
Wave 2 – Occurs when market drastically rolls back from recent prices. It can roll back 100% from the size of Wave 1, but not lower than its opening price. Usually it is around 60% size of Wave 1, it develops against the main trend part of investors are taking profits.
Wave 3 – There is a sharp increase in optimism among investors. This wave most of the time is the largest with almost no corrections. It can never be the shortest. Prices accelerate and volumes increase. Typical Wave 3 exceeds Wave 1 at least 1.618 times and maybe even more.
Wave 4 – This Wave is often difficult to identify. Usually it rolls back by no more than 38% of Wave 3.
Wave 5 – This wave is identified by divergence. Rising prices when average trading volumes dominate on the market. By the end of the wave, there is often a sharp increase in trading volumes.
Three Rules of Elliot Waves Theory
There are 3 rules that can help traders to apply theory to a specific chart:
Rule 1: Wave 2 cannot fall below wave 1 entry level.
Rule 2: Wave 3 cannot be the smaller than wave 1 or wave 5
Rule 3: Wave 4 cannot intersect with wave 1


